Watch Window
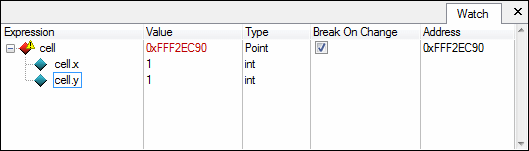
The Watch window is similar in nature to the Variables and Call Stack window except that you can define your own combination of variables and expressions to view. The Watch window displays values in red to indicate a change in the variable value since you suspended the program.
To open the Watch window, select Window»Watch in the active LabWindows/CVI window.
The Watch window contains the following columns:
- Expression—Displays the variable or expression to evaluate.
The following table describes the watch expression icons:
Icon Description 
Ordinary watch expression. 
Watch expression with Break On Change enabled. The value has not changed. 
Watch expression with Break On Change enabled. This expression caused the program to suspend because the value changed. 
Watch expression with Break On Change enabled. This expression caused the program to suspend because the value changed. However, the source location is slightly offset because of one the following factors:
- The value was modified by the previously executed line.
- The value was modified by the previously executed line and the current thread might not have triggered the value change.
- Value—Displays the value of the variable or expression.
- Type—Displays the data type of the variable or expression.
- Break On Change—Suspends the application when the value in the Address column changes.

Notes - The Break On Change option may not suspend in the same thread in which the change in value of the watch expression occurred. This option may suspend the program in a different thread, making the cause for suspension unclear.
(Windows) This issue can occur only when the watch expression represents a value over 4 bytes on 32-bit systems or 8 bytes on 64-bit systems.
(RT) This issue can occur for any watch expression. - The Break On Change option monitors a fixed memory address. When you use this option with a local variable, LabWindows/CVI monitors an address on the execution stack. Other functions might reuse the same location and LabWindows/CVI might report changes outside of the intended context of the watch expression.
- The Break On Change option may not suspend in the same thread in which the change in value of the watch expression occurred. This option may suspend the program in a different thread, making the cause for suspension unclear.
- Address—Displays the fixed memory address of the variable or expression value.
The Watch window displays extended information for certain data types that you can use when debugging your LabWindows/CVI application. Some LabWindows/CVI-defined data types automatically display extended data. For example, a variable of ListType displays the number of list items. You can expand the variable to view the contained list items. For other data types, you can choose to interpret the variable as a specific data type. For example, to interpret a panel handle variable, an integer value, as a true panel handle, right-click the variable and select Specific Type»Panel Handle from the context menu. LabWindows/CVI displays the title of the panel next to the integer value. You can disable the extended data display in the Watch window by deselecting the Enable extended Variable/Watch window displays checkbox in the Environment dialog box.
You can view some Watch window variables and expressions in the Graphical Array View, Array Display, and Memory windows. Select the text you want to view and drag it into the windows.
Right-clicking in the Watch window displays the context menu with the following options:
- Edit Value—Change the value of the expression.
- Edit Watch Expression—Make changes to the watch expression.
- Remove Watch Expression—Remove the watch expression you select in the Watch window.
- Add Watch Expression—Add a new watch expression.
- Find—Find text in the Watch window.
- Specific Type, or when right-clicking an array, Specific Type of Elements
Note LabWindows/CVI updates this list depending on the instrument drivers that you use in your application. For example, if you load the Programmer's Toolbox, List Type (Toolbox) displays in this list. - None (default)—Interpret the variable according to its basic data type.
- RGB Color—Interpret the data type as a RGB color.
- Unicode Code Point—Interpret the data as a Unicode code point.
- Unicode Key Code—Interpret the data as a Unicode key code.
- Time (ANSI C Library)—Interpret that data as time_t and display the current calendar time.
- Date Time (UI Library)—Interpret the data type as a DateTime value and retrieve the current date and time.
- Panel Handle—Interpret the data type as a panel handle and identify the name of the panel.
- Thread Lock Handle—Interpret the data type as a thread lock handle and identify the handle.
- Thread-Safe Queue Handle—Interpret the data type as a thread-safe queue handle and identify the handle.
- TCP Conversation Handle—Interpret the data type as a TCP conversation handle and represent the connection between the server and the client.
- VISA Instrument Session Handle—Interpret the data type as a VISA instrument session handle and display the name of the device.
- Element Type—Interpret the contained element for some aggregate data types, such as ListType and CmtTSQHandle, as a specific typed object rather than as a generic memory block. This option appears only if you right-click on an aggregate data type.
- Format
- Decimal—View the expression in decimal format.
- Hexadecimal—View the expression in hexadecimal format.
- Octal—View the expression in octal format.
- Binary—View the expression in binary format.
- ASCII—View the expression in ASCII format.
- Floating Point—View the expression in floating point format.
- Scientific—View the expression in scientific format.
- Preferences—Set default formats.
- View
- Array Display—View the expression in the Array Display window.
- Memory—View the expression in the Memory Display window.
- Graphical Array View—View the expression in the Graphical Array View.
- Options
- Variable Size—Display the number of bytes the variable consumes.
- Interpret As—Display a variable as if it were another type. Selecting a type from the Available Types dialog box displays the variable as the new type.
- Estimate Number of Elements—Estimate the number of elements for a variable.
- Release/Confine Window—Release the window from the Debugging Region if confined. Confine the window into the Debugging Region if released.
Right-clicking on the tab of the Watch window displays the context menu with the following options:
- Close—Close the window.
- Release Window—Remove the window from the Debugging Region.